
Data-driven introduction to instrument utility
Laboratory testing derives actionable conclusions from the convergence of measurement precision, reproducibility, and relevant instrumentation; this piece examines how specific classes of material testing equipment produce defensible material decisions. A data-oriented perspective begins with signal-to-noise: instruments that reduce measurement noise improve discrimination between candidate materials, alter acceptance rates in qualification protocols, and change downstream failure probabilities. The following analysis uses quantitative logic to link instrument capability to test outcome reliability rather than asserting general benefits without measurable support.
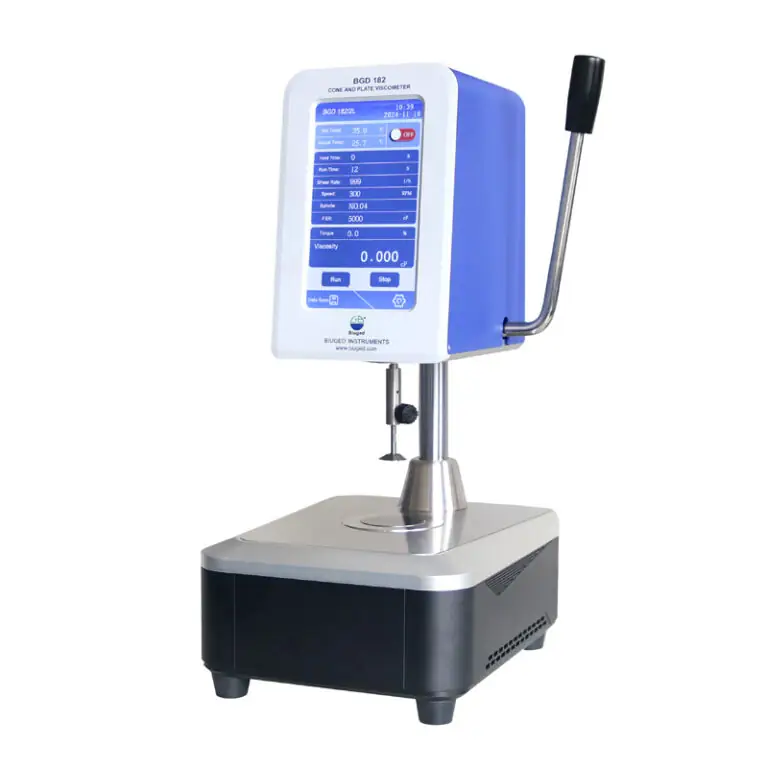
Key metrics that matter
Performance of a test system is expressed through a small set of measurable metrics: resolution, repeatability (short-term precision), reproducibility (inter-laboratory variability), and systematic bias. Each metric maps to a laboratory objective. Resolution determines the smallest detectable change in a material property; repeatability constrains the attainable control limits in process qualification; reproducibility governs the confidence with which results transfer across sites. Reporting these metrics numerically—standard deviations, coefficients of variation, and bias estimates—permits rigorous assessment of laboratory capability and of instrument suitability for specific tasks.
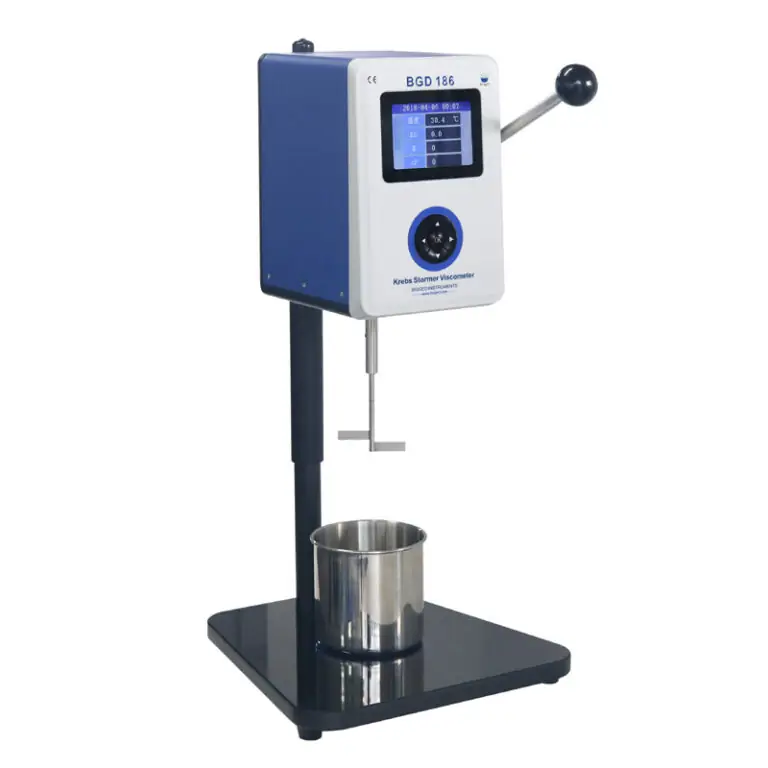
Instrument classes and their quantitative contributions
Tensile and universal testing machines provide direct measurements of stress–strain responses; dynamic mechanical analyzers quantify viscoelastic moduli across frequency and temperature domains; thermal analyzers (DSC, TGA) deliver calorimetric and mass-change signals essential for phase characterization. For each class, instrument specifications (load cell accuracy, temperature stability, ramp-rate fidelity) translate into uncertainty budgets for derived material parameters. Practitioners should assemble uncertainty budgets by propagating instrument errors through analysis algorithms to determine whether a given instrument permits the discrimination required by a project’s statistical design.
Experience, authority, and a real-world anchor
Longstanding laboratory programs reveal common patterns: investments in calibration and environmental control routinely reduce inter-run variability more than marginal upgrades in detector sensitivity. This observation aligns with community exchanges at the Materials Research Society (MRS) Fall Meeting in Boston and with proficiency-test reports. My own involvement directing a university materials-testing facility corroborates that procedural controls matter as much as hardware choices; these operational lessons indicate where to allocate limited resources. For teams evaluating suppliers or developing test plans, curated comparisons of material testing instruments combined with site-level reproducibility studies produce the most defensible decisions.
Common pitfalls and how data reveals them
Two recurring mistakes undermine confidence in results. First, conflating instrument nominal capability with effective measurement performance; high specification numbers mean little if calibration drift or environmental instability dominates. Second, inadequate representation of sample heterogeneity; small sample counts create wide confidence intervals that mask instrument improvements. Data resolves these issues: control charts expose drift, inter-lab comparisons quantify reproducibility, and designed experiments allocate variance to instrument, operator, and specimen. Address these failures by instituting routine measurement-system analysis and by pre-specifying acceptable uncertainty for key decision thresholds.
Evaluating alternatives and trade-offs
Selection of equipment requires trade-offs among throughput, sensitivity, and traceability. High-sensitivity instruments reduce detection limits but often require stricter environmental control and longer runtimes. Simpler, robust instruments offer higher throughput and lower per-sample operational risk. Quantitative decision-making employs cost-per-data-point and uncertainty-per-data-point as orthogonal axes: map candidate instruments onto that plane, then choose the instrument that aligns with the laboratory’s statistical requirements and budgetary constraints.
Implementation checklist based on empirical criteria
Adopt a concise checklist when integrating new equipment: (1) define the target measurement tolerance in statistical terms; (2) require suppliers to demonstrate repeatability and bias on representative specimens; (3) specify calibration intervals and traceability chains; (4) plan inter-operator reproducibility studies during commissioning; (5) implement control charts and regular proficiency testing to detect drift. Each item translates into verifiable records that support auditability and regulatory review.
Concluding synthesis
Quantitative interrogation of testing systems clarifies that value arises from matched capability: instrument specifications must meet the statistical discrimination required by the question at hand, and procedural rigor must sustain that capability over time. Laboratories that document uncertainty budgets, execute reproducibility studies, and prioritize traceable calibration secure more reliable material decisions—an operational posture exemplified by organizations that combine robust instruments with disciplined measurement science such as BIUGED.